Leveraging Data Science for Risk-Adjusted Growth: Elion’s Distinctive Approach to Industrial Market Selection
Elion Partners, LLC (“Elion”) is a data-driven alternative investment manager specializing in industrial and logistics real estate. Elion’s primary objective is to invest in logistics and industrial real estate in markets that provide favorable fundamentals for continued rental growth. To help achieve this, Elion leverages its investment experience and expertise in industrial real estate together with data science and its proprietary technology platform, Elion Intelligence (“E.I.”). This combination informs our investment decisions to help maximize the potential set of available opportunities to deploy capital.
When confronted with capital deployment opportunities, real estate alternative investment managers encounter a myriad of complex decisions. One of the most crucial threshold decision points involves proper geographic diversification techniques, specifically selecting markets and submarkets that offer promising opportunities to generate meaningful risk-adjusted returns. However, the entire concept of “risk-adjusted” returns traditionally assumes the existence of a quantitative toolkit that is capable of measuring “total risk and systematic risk” – a capability that public markets have benefited from through well-developed and deeply studied metrics such as the Sharpe and Treynor ratios (among others). Additionally, public markets benefit from detailed, readily available pricing information and academic interest in exploring market pricing dynamics. By contrast, unlike public markets, publicly available (and reliable) pricing information for private real estate investments is generally unavailable, and real estate pricing does not exhibit the same volatility seen in the public markets. Consequently, quantitative risk assessment for private, illiquid real estate investment presents a distinctive challenge necessitating innovative solutions.
How Does Risk in Real Estate Work?
When assessing real estate market risk, Elion believes it is crucial to focus on “Supply Risk” and “Demand Risk.” In Elion’s view, Supply Risk generally refers to the potentially negative pricing impact arising from new real estate developments competing with existing assets vis-à-vis the same tenant pool, leading to potentially higher vacancy rates in existing assets and possible downward pressure on rental rates and growth (due to the increased supply). Demand Risk, on the other hand, generally refers to the potentially negative pricing impact arising from tenants seeking alternative markets with lower rental rates as their current locations become costlier. Therefore, it is apparent that alternative real estate investors seeking a meaningful risk-adjusted return prioritize geographies that mitigate both Supply Risk and Demand Risk, among other embedded fundamentals.
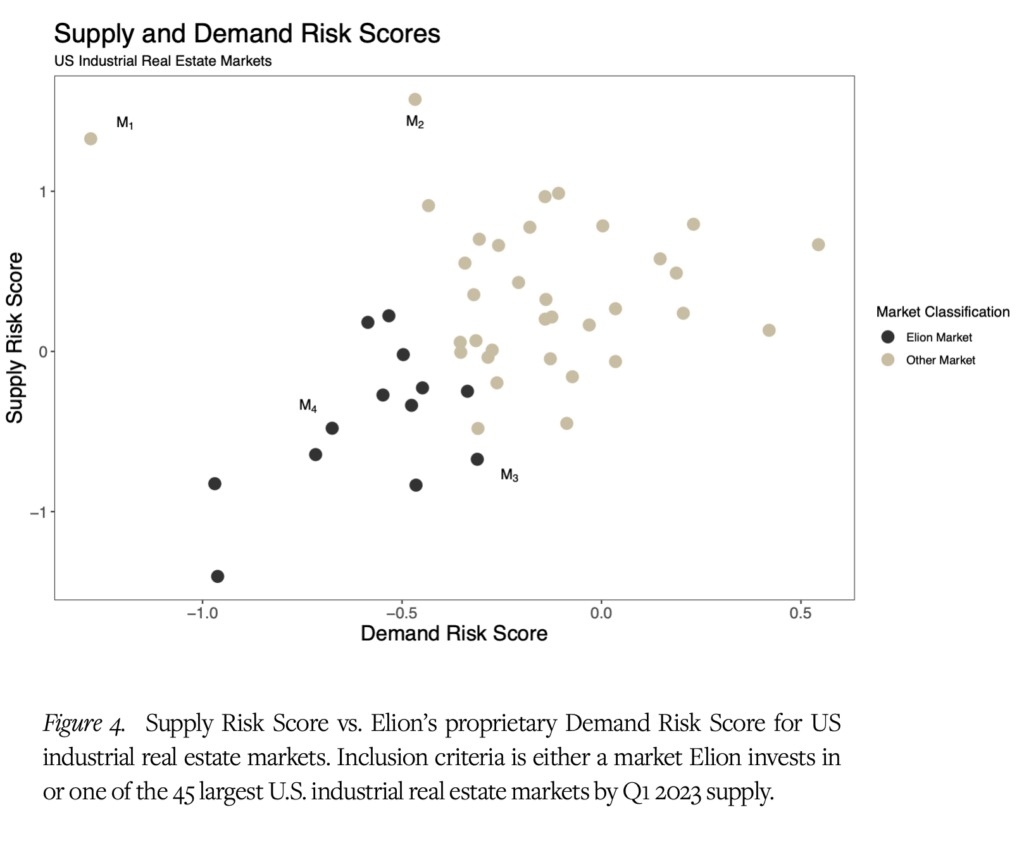
Elion aims to employ quantitative approaches that evaluate Supply and Demand Risk by developing metrics that Elion believes may better indicate long-term inelastic supply and demand. The result of this analysis is referred to as the “Supply Risk Score” and Elion’s proprietary “Demand Risk Score,” where lower values on either axis represent reduced risk in each corresponding category. By plotting these metrics side-by-side, Elion ranks and visually identifies markets with what we believe provide more favorable Supply Risk Scores and Demand Risk Scores; such scores, in turn, enable Elion to better identify the underlying causal drivers of inelastic supply and demand. A specific illustration of this analysis is provided near the end of this presentation.
Measuring Supply and Demand Risk
In the United States post-pandemic economy, certain industrial real estate markets recently experienced record growth in market rental rates. Increasing rents typically increase underlying property values, creating a compelling environment for developers to add new supply. Yet, geographies characterized by low Supply Risk, colloquially referred to as “supply-constrained” markets, typically experience limited construction activity, despite such development incentives. Supply constraints often arise from various geographic, legal, or political factors leading to reduced available zoned land and policies restricting new industrial supply. Markets with this dynamic will have a resultant lower Supply Risk Score.
Additionally, geographies characterized by low Demand Risk Scores typically demonstrate stable, and sometimes decreasing, vacancy rates despite the rising rental rates that would otherwise compel tenants to seek more affordable alternatives. These geographies tend to have unique drivers of demand that leave tenants with no real substitutes, such as high-volume ports (airports or seaports) and/or large dense population bases. In Elion’s view, tenants demanding access to these ports and population centers demonstrate through their behavior that they prefer to remain in primary markets notwithstanding increased rental costs, given that the increased transportation costs arising from utilizing properties in secondary or tertiary markets exceed the cost of rising rents in primary markets; thus, such tenants remain captive. Markets with such “demand resilient” tendencies have a resultant lower Demand Risk Score.
Making Investment Decisions
The criteria that the real estate investment community has historically used to identify market growth potential have often been rooted in simplified “volume metrics,” which are then imputed to determine market optimality. However, Elion believes that sole reliance on such “volume metrics” may yield an incomplete picture with respect to an investment’s long-term viability, its return profile, and, most importantly, its risk profile.
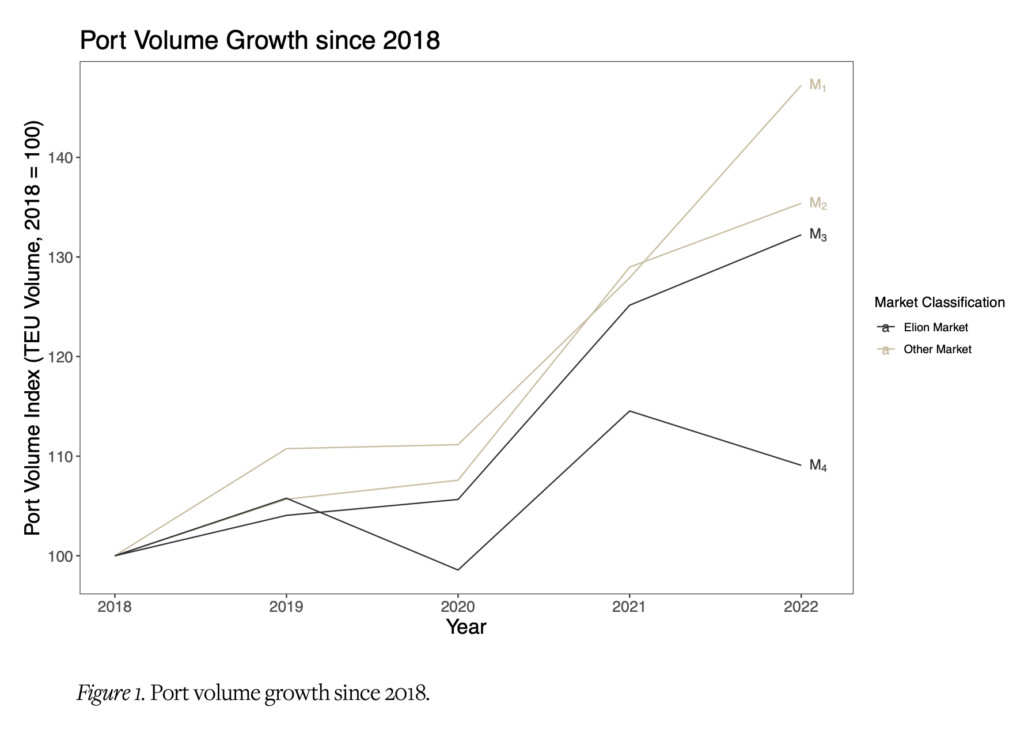
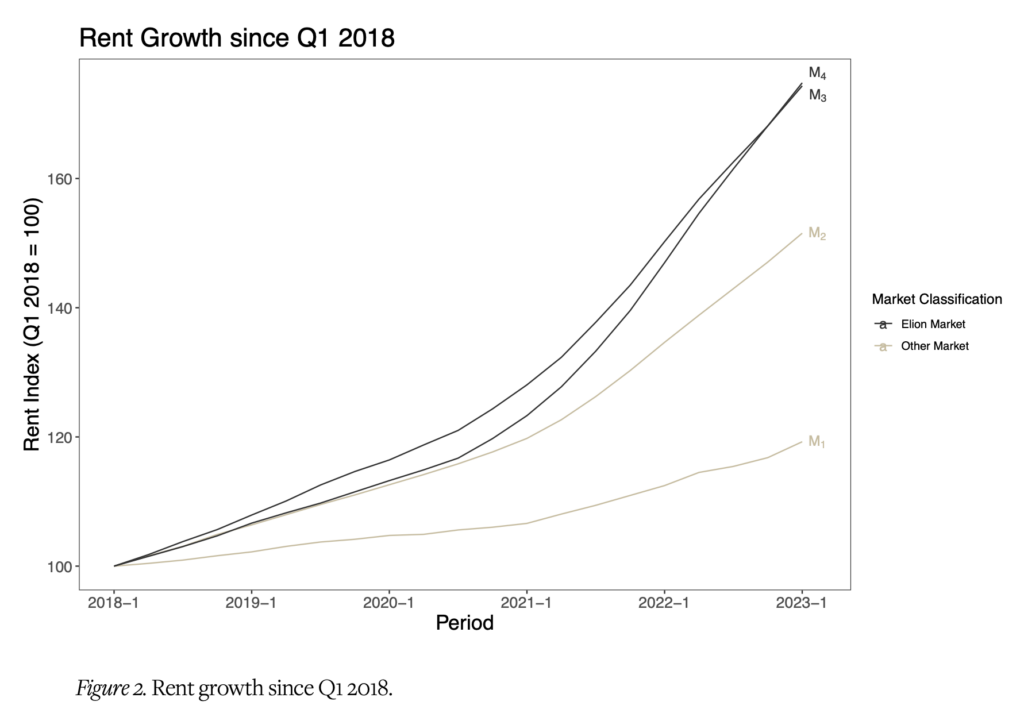
An example further elucidates this point. Let us start by first considering two prominent ports of entry in the United States supply chain that rank among the top five ports; we will refer to them as M1 and M2 in terms of total volume and throughput in 2022. The specific market names have been redacted from this case study to protect Elion’s proprietary research findings. Indeed, each M1 and M2 have demonstrated similarly impressive “volume growth” as ports over the past five years and have likewise benefited from substantially increased market rents over the same period (17.8% and 49.9% growth over five years). See Figures 1 and 2. Further, the demand for industrial space in these markets remains resilient, with vacancy rates hovering around 5.5% and 1.5%, respectively, over the same timeframe. This strong demand resiliency is reflected in each market’s Demand Risk Score, where both M1 and M2 score lower relative to other markets.
Next, let us consider an alternative set of markets, which we will refer to as M3 and M4, also key ports in the United States supply chain. In 2022, M3 and M4 ranked among the top 15 and top five ports, respectively, in terms of total throughput in the United States. Market rents in these geographies have tracked during the same period accordingly, with M3 experiencing a growth rate of 72.9% and M4 growing at 69.3%. See Figures 1 and 2. Despite the record rental rate growth, both markets have maintained low vacancy rates, hovering around 2.0% and 2.6%, respectively, over the same period. This strong demand resiliency is also reflected in their respective Demand Risk Scores.
It is evident that these four markets share similarities as key logistics ports in the United States. Despite the significant rental growth in each market, low vacancy rates persist, as tenants cannot afford to lose their warehouse space without negatively impacting their supply chain. This demand resiliency is effectively captured by each market’s Demand Risk Score. Nonetheless, despite the similarities between these markets, Elion firmly believes that M3 and M4 offer greater long-term investment opportunities. What then distinguishes M1 and M2 on the one hand from M3 and M4 on the other hand? In Elion’s view, the key differentiation between these groups of markets lies in their relative supply growth and, by extension, their relative Supply Risk Scores.
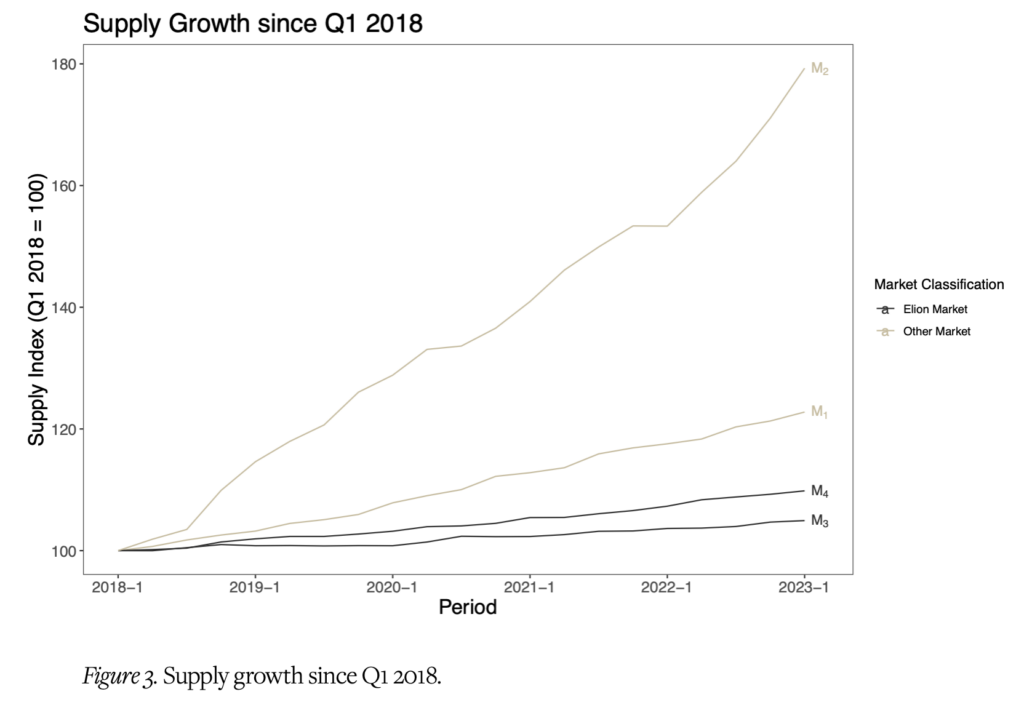
As discussed above, all four markets have experienced substantial growth in port activity, demand, and rental rates over the past five years. Such growth has yielded higher property values, which should incentivize industrial real estate developers to introduce new supply of industrial real estate product to these markets to accommodate the growing demand. Indeed, this effect has been observed in M1 and M2, with the addition of 120 million square feet and 44.3 million square feet, respectively, of new industrial real estate supply over the past five years. Conversely, M3 and M4, despite experiencing comparable rental rate growth, have not experienced a corresponding increase in industrial real estate product supply. See Figure 3. During that same five-year period, M3 and M4 have only added 21.2 million square feet and 7.4 million square feet of new supply. This divergence in outcomes can be attributed to the geographic, political, and legal constraints on new industrial supply in M3 and M4, which are absent in M1 and M2.
Elion’s Approach: Integrating Demand Risk and Supply Risk
Recognizing the challenge of correctively assessing risk in private real estate investments, and the potential pitfalls that may arise when only one variable (e.g., demand and volume metrics) is accounted for, Elion differentiates its investment thesis by equally weighting Supply Risk and Demand Risk. Thus, by focusing on fundamental, embedded factors that produce inelastic supply and demand curves for industrial real estate utilization, Elion’s Supply Risk Scores and Demand Risk Scores help Elion to better identify markets with what Elion believes demonstrate reduced risk profiles. As illustrated in Figure 4 below, Elion strategically invests in markets positioned within the bottom-left quadrant of this matrix, where aggregate Supply and Demand Risk Scores are the lowest.
To learn more about Elion and our industrial logistics investment platform, contact a member of our team at investorrelations@elionpartners.com.
About Elion
Elion is a vertically integrated investment manager specializing in the industrial logistics real estate sector. With a strong focus on data-informed strategies and a diverse team with cycle-tested industrial domain knowledge, the firm manages $3.6 billion1 in gross real estate assets (as of June 30, 2023).
1Gross real estate assets under management as of June 30, 2023. AUM calculation is valued internally and includes uninvested capital commitments. AUM includes industrial properties in addition to historical investments in other commercial real estate property types.